Statistics, the facts don't lie...or do they
Saturday 1st March, 2014
The most important thing to remember when we think about statistics is that each number on a page or a report represents an individual or a group. Sometimes it is easy to see 100 incidents of violence per week and think 'gosh thats awful' or 'oh well' but that's 100 individual people like you or I that have been injured physically and emotionally. Statistically the most high risk category for assault is age 15-24yrs so worse still those individuals may be our brothers, sisters, best friends, children or grand children.
Since 1996 the world has known that violence is a worldwide major public health problem. The World Health Assembly classified it as such triggering much research culminating in the World Health Organisations (WHO) report on Violence and Health (2002). Using mortality data relating to violence a scary picture emerged. In 2000, 199,000 people worldwide between the ages of 10-29yrs were killed as a result of violence. Shockingly only 1/5 of this was due to armed conflict! The WHO acknowledged that this data represented mearly the 'tip of the iceberg'. For each of those young people killed there was an estimated 20-40 other individuals injured as a result. Altogether thats a staggering 3,980,000 - 7,960,000 individuals affected by violence each year! If this is the 'tip of the iceburg' we should be very concerned.
Following the release of the WHO's report subsequent reports have been released including one here in the UK focusing on violence in England and Wales. This was released in 2005 by the Liverpool John Moores University in partnership with the WHO. This report identified that 60% of all violence in the UK (at the time 2.7 million incidents per year) was committed by or against young people with the second leading cause of hospital admission amongst 15-24 yrs was from assault.
One of the major outcomes of these reports was the need for more robust data collection systems to analyse and understand the root of the problem and to monitor improvements/deteriorations. There were also many suggested interventions, particularly in primary prevention such as education.
Until 2012 and after the London riots our Government had not produced any further reports or research into violence since the Violent Britain report in 2005. Whether this is coincidence that the riots kicked them up the backside or whether this was underway already is unclear. Many of the interventions recommended by the earlier papers are also clearly being implemented so it is unlikely that the Government did just sit on their laurels for those 7 years. Interventions such as increasing health visitor input, parenting classes, early intervention in child protection and the list goes on.
However the issue of statistics and data still seems to be a troublesome one. There are a whole variety of data sources out there including Home Office (HO), Office for National Statistics (ONS), Liverpool John Moores (LJM), WHO, Violence Indicator Profiles for England Report (VIPER), Local Alcohol Profiles for England (LAPE), Hospital Episode Statistics (HES), South West and NW Observatories (SWO & NWO). Rather confusing!
In the nursing profession we are continually taught about evidence based practice. To ensure our practice is up to date we are encouraged to read multiple research articles, never just one on the same subject, look at the potentially bias elements ie its written by a drug company who recommend their drug, assimilate the information and incorporate it into our practice. This is how I have always worked and will continue to work. Read multiple articles and collate data from multiple sources and then go with the most accurate and robust. For example if 3 sources of data show the same thing and 1 shows something dramatically different which would you believe?
When delivering a recent speech I quoted statistics from VIPER, WHO, NWO now part of Public Health England, HES and ONS. All up to date statistics and all were very similar so these are the ones I used. It was met with a very frosty reception by some in the room who bristled when the statistics for the local area were not as positive as they thought. After the presentation I was offered 'up to date statistics', but when I responded saying 'they were up to date' it was questioned where I got them from. The individual in question had not heard of VIPER, NWO or LJM and as it is presumably their job to know of the evidence this surprised me. They get their statistics from the Crime Survey for England and Wales (CSEW) only which is compiled by the ONS. It was suggested that the other sources were 'wildly inaccurate' and that I should draw my data from the HO and ONS. I'm never happy to accept what others say without exploring things first.
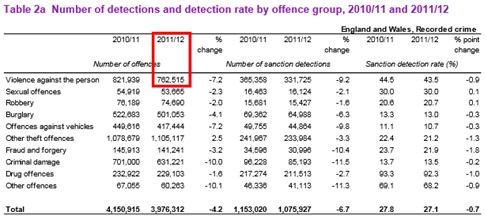
After looking over the statistics the data sources from VIPER and others were actually from the ONS and the HO but yet the CSEW statistics showed violence to be less of an issue than the stats used in the speech. I asked myself why this was and thought it a good idea to investigate. I contacted all those mentioned above who produce the data and the answer was, as always how crime is categorised. This year after consultation the ONS who produce the CSEW decided to change the classifications of violence and split them down into various categories. The new categories meant that unless there was a victim the violent incident would not be recorded as 'violence against the person'. In reality this means that an incident of violence such as a pub brawl where there is no specific victim would be recorded in a different category, not as 'violence against the person'. This is fine but it is still an incident of violence. However the result on the statistics means that 'violence against the person' has now dropped dramatically. This would be something I would want to understand and not just accept on face value. Below is a very good example shown to me by the Centre for Public Health demonstrating very clearly the incomparability of published data when categories change. There are two charts recording violence from two separate reports, one in a report from 2011/12 and the other from 2012/13. If you look at the figures from 2011/12 in both reports (highlighted in red) you will see they are different figures. Incomparable.

Those who use the CSEW and only these statistics would be pleased to see the results but sadly this does not mean that all is rosy. It is still the case that excluding London the South West has the 3rd highest rate of violence against the person in England and Wales. The ONS themselves also pointed out that we should not rely on police statistics around recorded crime as this does not give a true picture. I have not been encouraged to look at this but 8 years ago when SAV began this was the main source of information I was urged to look at. I guess it was publicly acknowledged in the mean time that these stats are unreliable and shouldn't be used and so the focus changed to the next thing which showed the least damning information. This graph shows why recorded violence should not be used. Hospital admissions due to assault continue to remain high yet the number of incidents reported to the police are falling. This does not mean violence is improving but that less incidents are being reported to the police.
It should also be pointed out that the CSEW is also just a survey. 50,000 surveys were conducted to collect the information which may seem a lot but as the population of the UK is 63.7 million (ONS 2013) this is a very broad and crude picture.
It is a shame that the powers that be look only to one source for their information and that this source happens to be the CSEW which only offers a broad picture and uses new categories, and provide false hope to the people. If we cannot be honest and measure violence in a truly comparable way how will we ever know if it is reducing, staying the same or getting worse. In the words of the ONS the stats on VIPER are not 'wildly inaccurate' but simply not organised into the new categories.
So yes, statistics can lie depending on who is interpreting them and how they are doing this but it is the duty of those who can make a difference to look at ALL available data and realise the truth not just focusing on the stats that make them look good and feel positive. The NWO and Public Health England are in the process of updating their data to conform to the new categories. Once this is done it will make comparisons much easier and I will welcome that with open arms.
I would love to see an improvement in violence and the stats do suggest that we are heading in the right direction but unfortunately we still have a long way to go and things are not as positive as some would have us believe or believe themselves. If we think we are out of the woods and on the road to recovery already then I fear we may see another increase because of complacency. We shouldn't stop running until we are well over the finish line and even when we are over the line we should continue to focus on prevention through education to ensure we do not fall back into the cycle of violence we see at the moment.
The moral of the story is not to believe everything we are told and to look at all the facts. I for one will continue to use a wide range of sources of information to ensure I have the most accurate information to inform SAV.